Dashboard
Beautiful. Fast. Informative.
Native SVG charts with zero external charting libraries. ~100MB RAM footprint.
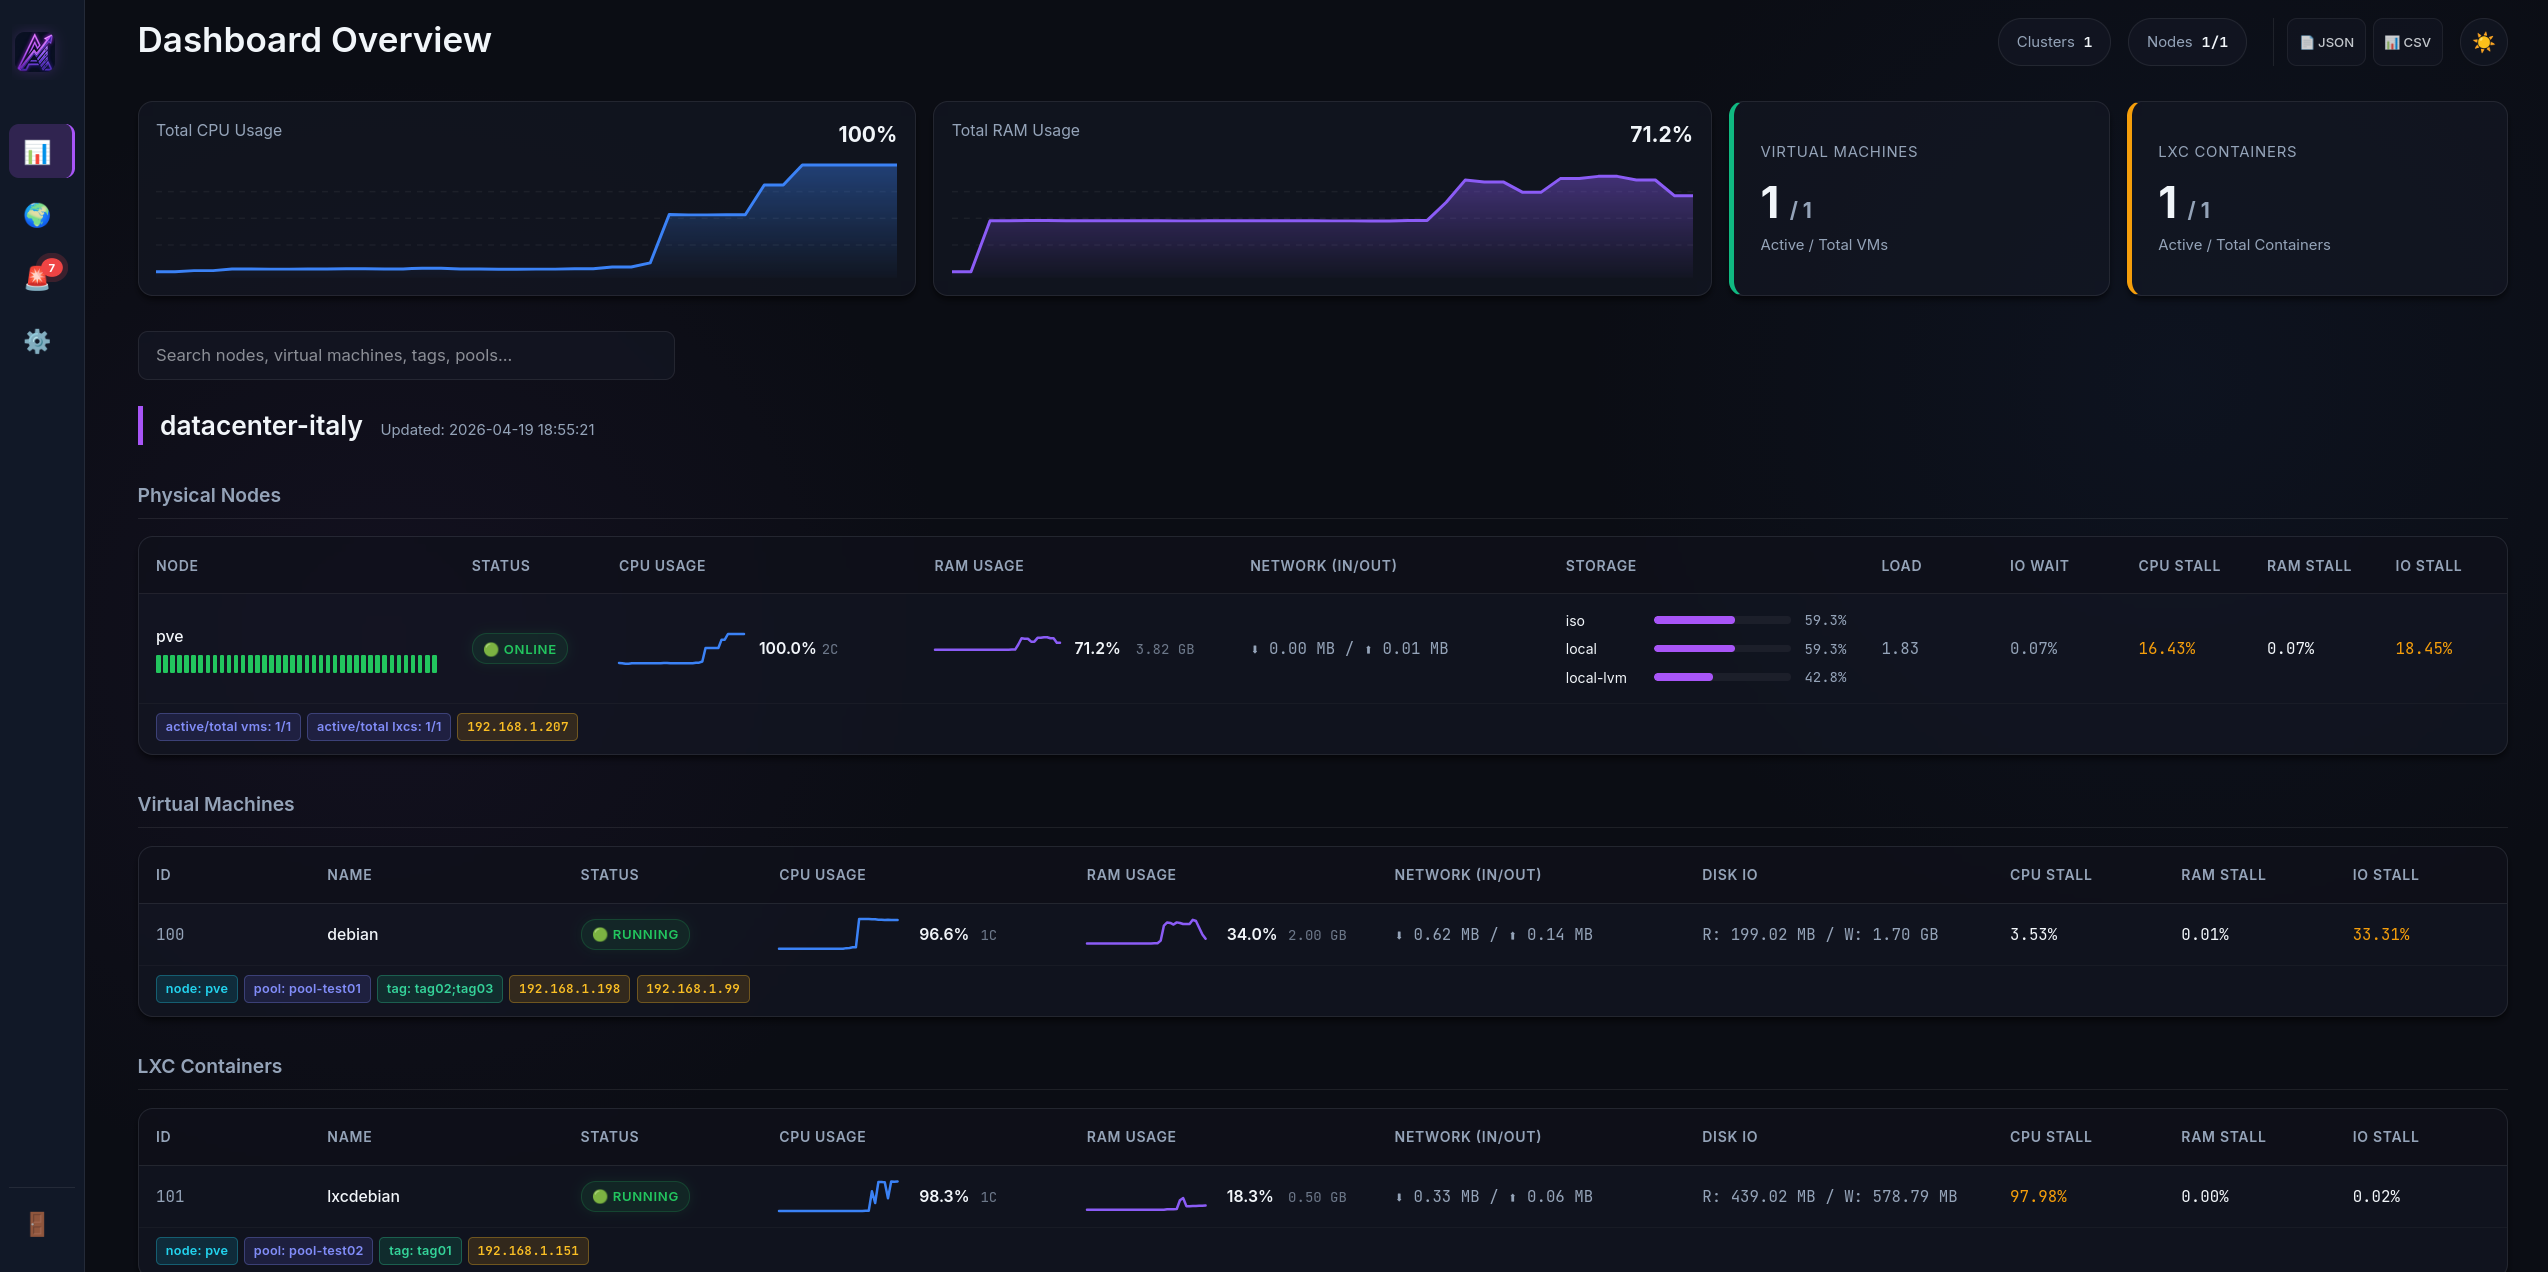
One dashboard. Every cluster. Real-time metrics, anomaly detection, and capacity planning — deployed in 60 seconds.
$ ▊
Built for sysadmins and DevOps teams who need full visibility into their virtualization infrastructure.
Live metrics via Server-Sent Events. No polling lag, no WebSocket overhead. CPU, RAM, Storage, Network, Disk I/O — all in real time.
Monitor unlimited Proxmox VE clusters from a single unified dashboard. Add clusters via the UI — no config files required.
AI-powered 3σ deviation alerts via Prometheus PromQL. Automatically detects abnormal CPU, RAM, and network patterns.
Simulate node failures before they happen. Predict VM migration outcomes and identify capacity bottlenecks in seconds.
Browse 30 days of historical metrics with interactive Prometheus-backed charts. Uptime heatmaps for every node and VM.
Configurable threshold alerts with webhook notifications to Slack, Teams, and Discord. Per-resource silencing and cooldowns.
Native SVG charts with zero external charting libraries. ~100MB RAM footprint.
Try Proxmox Atlas with a fully simulated Proxmox infrastructure. No installation required — just log in and explore.
demo01
demo01
Nginx terminates SSL, serves static assets, and reverse-proxies the API. Backend and Prometheus are fully internal — never exposed.
One command. Self-signed HTTPS certificate generated automatically. No manual configuration needed.
$ curl -sSL https://raw.githubusercontent.com/Losstarot85/proxmox-atlas/main/install.sh | bash
Default credentials: admin / admin — You'll be prompted to change the password on first login.
Auto-generated self-signed certificate. Replace with Let's Encrypt or your own CA anytime.
Stateless Bearer tokens with bcrypt-hashed passwords. Forced password change on first login.
HSTS, X-Frame-Options, X-Content-Type-Options, Referrer-Policy enforced by Nginx.
Backend runs as unprivileged atlas user. No root access inside containers.
Prometheus and backend are never exposed to the host network. Only Nginx is accessible.
Fully open source. Audit the code, fork it, contribute. Your infrastructure, your rules.